2023 Student Retention Survey Results
In most higher education institutions, about a third of all first-year students eventually opt to transfer. To delve deeper into the reasons behind such decisions, we surveyed students transferring in the Fall of 2023. The feedback offers crucial insights, shedding light on ways to enhance student persistence and retention. Dive into the survey data below and uncover the nuanced perspectives involved.

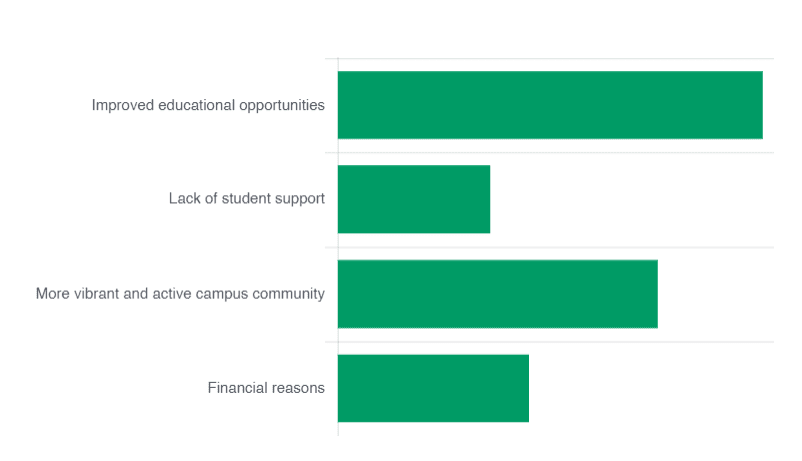
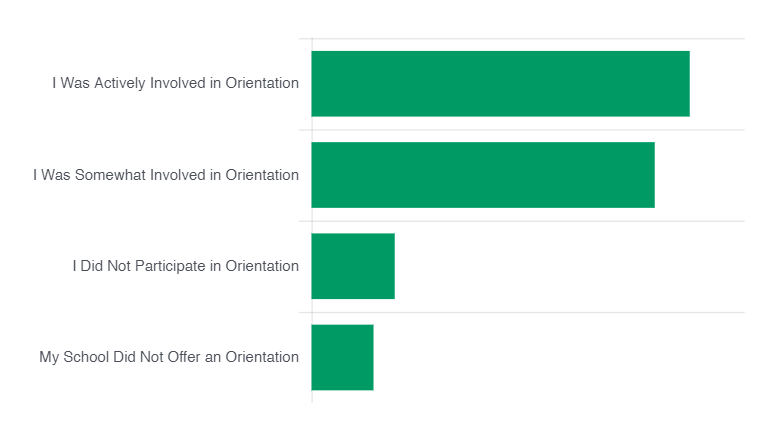
It’s evident that while educational opportunities are a primary factor for students transferring, the overall campus experience (orientation, amenities, extracurricular activities) and accurate portrayal of campus life also play critical roles in their decisions. Institutions focusing on enhancing these facets stand to see improved retention rates.
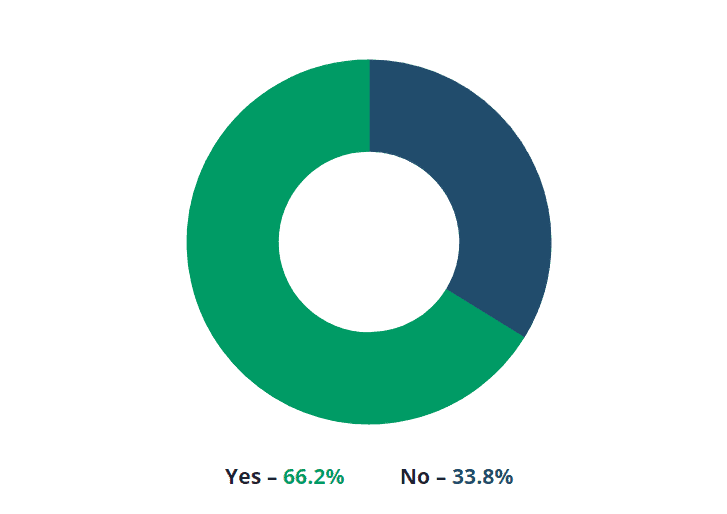
- 76% of the respondents believed that better online resources displaying actual campus life would have mitigated the disconnect.
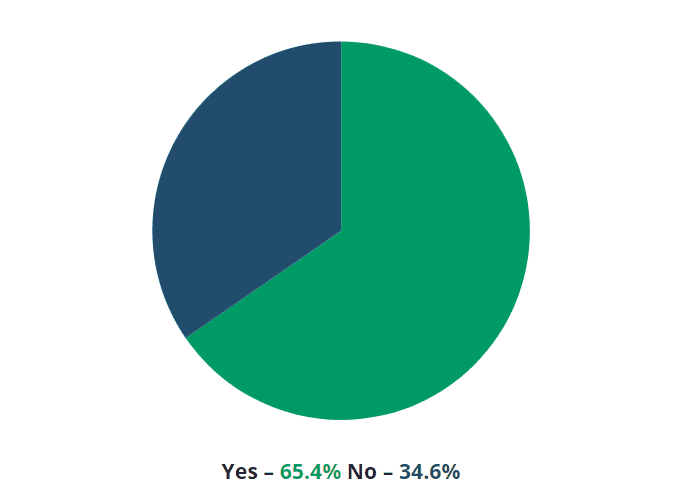
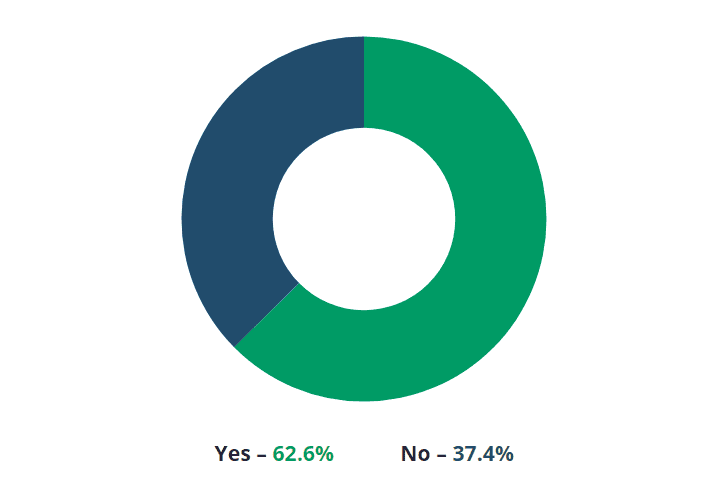
- 66% of the respondents indicated that more campus events at their original school would have influenced their decision to transfer.
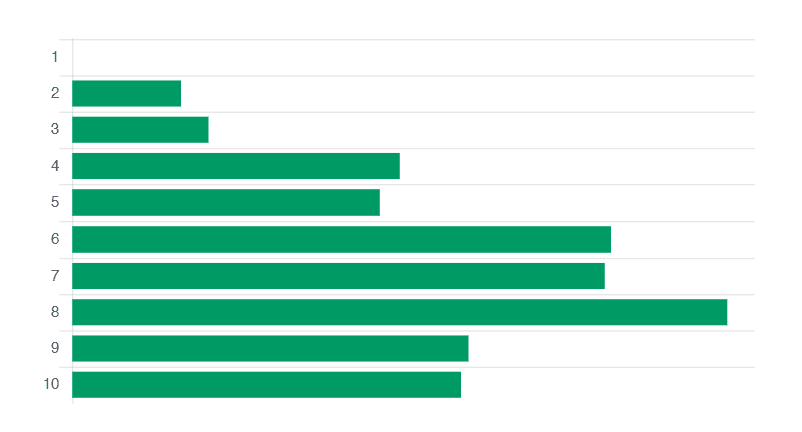
- The majority of respondents were involved in 2 student groups or extracurricular activities at their original school.
- The main reason for transferring schools among respondents was improved educational opportunities (39%).
Survey participants, all based in the United States, are predominantly aged between 25 and 34, with males representing 58%. Importantly, every respondent is not only currently enrolled in a college or university but is also in the midst of transferring from their original institution.
Student Perception

Watch our Recent Round Table on Student Retention & Persistence
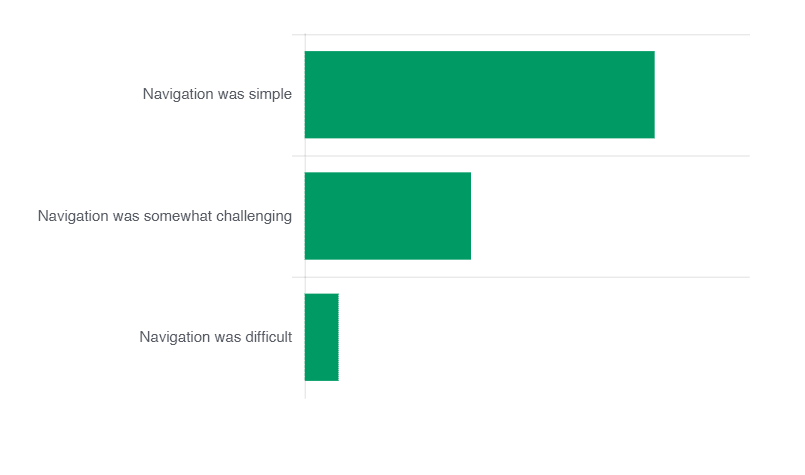

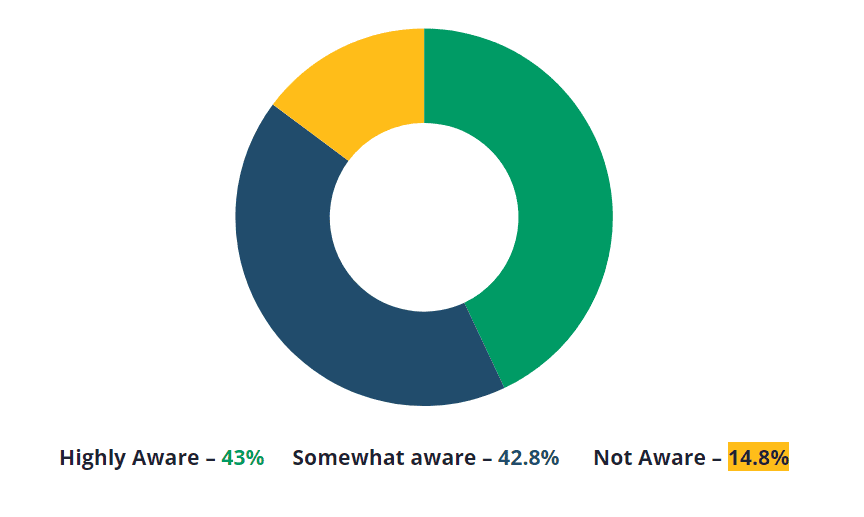
These survey results highlight notable discrepancies between students’ online perceptions and their on-campus experiences. The emphasis on accurate online representation and genuine campus engagements is evident. While many students prioritize educational opportunities, factors like campus orientation, amenities, and extracurricular involvement also significantly influence their decisions to transfer. Addressing these concerns is crucial for institutions aiming to enhance student satisfaction and retention.
Watch our Recent Round Table on Student Retention & Persistence
Seeing is believing.
See our technology come together in one seamless experience.