

There’s a moment every August when a college campus seems to change overnight.
Residence halls fill up. Parking lots get crowded. Families arrive with cars packed to the roof. New students try to find buildings they’ve never visited before, while returning students get reacquainted with campus and settle into a new schedule.
All of that activity creates a surge in another place too — the digital campus.
This back-to-school season, we looked at activity across the Concept3D platform to better understand how students, families, and visitors use campus maps and event calendars during one of the busiest periods of the academic year.
The scale was significant. But what people were doing, and searching for, tells an even more interesting story.
When campus gets busy, digital traffic follows
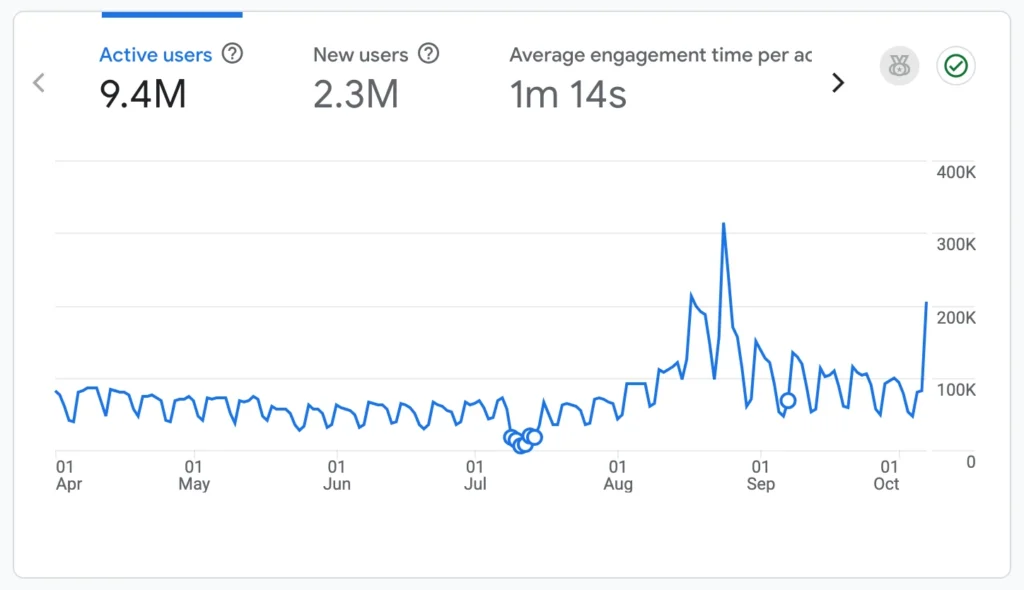
Throughout much of the summer, traffic across Concept3D Interactive Maps remained relatively steady at around 6 million system requests per day.
Then August arrived.
On August 24, traffic reached 39.5 million requests in a single day — approximately 6.6 times the summer baseline. During the busiest week, August 24–30, the platform averaged 19.3 million requests per day, more than three times typical summer traffic.
And the increase wasn’t limited to one big move-in weekend. After the late-August peak, school-day traffic remained elevated at roughly 10 to 16 million requests per day into September.
That makes sense when you think about what those first few weeks on campus actually look like.
Students aren’t only moving in. They’re starting classes, finding campus resources, attending orientation activities, exploring new buildings and establishing routines for the semester.
Each of those moments can create a need for information.
Millions of map interactions tell a bigger story
Between August 1 and September 11, Concept3D Interactive Maps recorded 10.94 million map views across 7.94 million sessions. Google Analytics also reported 3.27 million active users during the period, with 58.9% of reported active users accessing maps on mobile devices.
Phone usage is most notably important during back-to-school time, when there are students and visitors standing in parking lots, cutting between buildings, hauling boxes out of a car, or hurrying to make it to orientation or class on time.
In those moments, people need answers right where they are. And when we look beyond map views, we get a much clearer sense of what they were actually trying to do.
During the back-to-school period, visitors opened locations 9.45 million times, searched maps 2.53 million times, and requested directions nearly 1 million times. They also drilled into map category details 2.37 million times and selected building floors more than 750,000 times.
Those interactions turn an abstract idea like “digital campus engagement” into something much more concrete.
People had questions. They were using campus maps to find answers.
The most popular searches are surprisingly ordinary

So what was everyone looking for?
Parking topped the list.
People searched it more than 16,000 times during the back-to-school period. The library was close behind, followed by the bookstore and gym. Student union, restroom, and food also appeared among the most common searches.
This list will probably look familiar to anyone who has ever been new to a campus.
Where should I park?
How do I get to the library?
Where do I buy my books?
Where’s the student union?
Is there somewhere nearby to grab lunch?
These are simple questions when you already know the campus. When you don’t, they can become frustrating obstacles at an already busy time.
That’s an important reminder of what a campus map is actually there to do.
The goal isn’t simply to display buildings. It’s to help someone move from a question to an answer and from an answer to a destination.
Peak demand is when the experience matters most
Back-to-school traffic also reveals something important about the technology behind the campus experience.
Demand can increase very quickly.
On August 24, the busiest hour across the Concept3D campus-map platform handled 3.52 million requests. From 8 a.m. through 1 p.m. Mountain Time, the platform handled at least 2.7 million requests every hour. At 9:52 a.m., traffic reached 61,086 requests in a single minute.
Concept3D infrastructure scaled with the increased demand and kept services healthy throughout the surge.
For the person using the map, of course, none of those numbers matter.
They simply expect it to work.
And that’s the point.
The periods that put the greatest demand on campus technology are often the same periods when students and visitors need it most. Someone trying to find the right move-in location or make it to an orientation session doesn’t care that thousands of other people are doing the same thing.
Digital campus experiences must be ready for moments when everyone shows up at once.
Getting there is only the beginning
Once students figure out where they need to go, another question quickly emerges: What’s happening on campus?
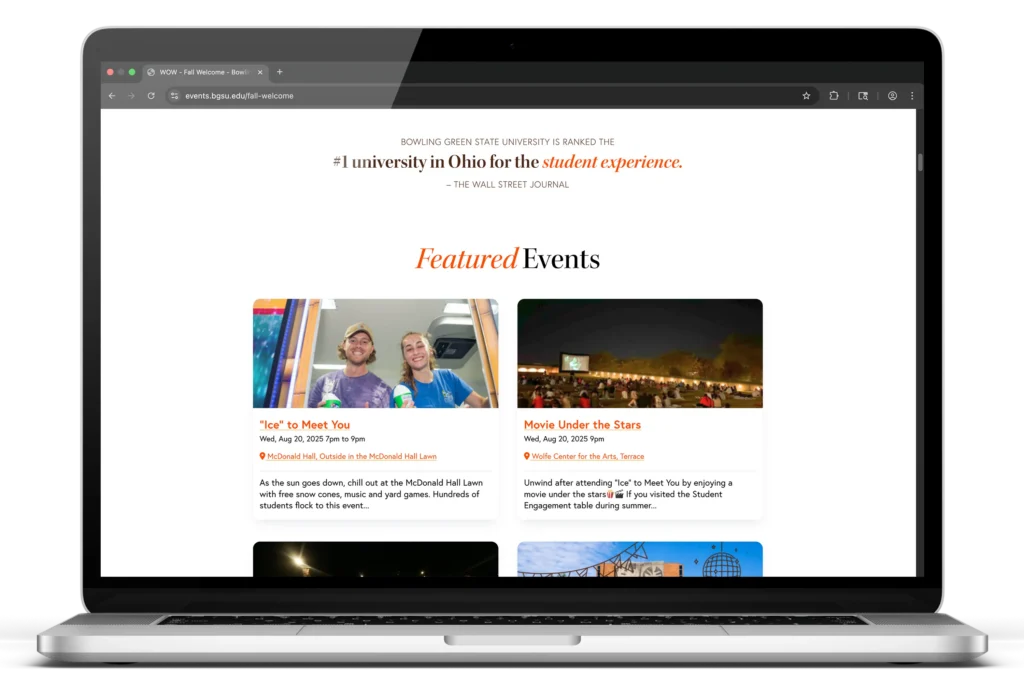
Welcome Week is designed to help answer that question. Campuses may offer hundreds of activities introducing students to organizations, resources, traditions, and each other.
Concept3D’s Localist Events data shows students were actively looking for those opportunities too. The five highest-viewed university event calendars included in our Welcome Week analysis generated 73,000 views during the period.
Maps and events serve different purposes, but during the back-to-school season they solve two closely connected needs.
Where do I go?
What can I do when I get there?
Together, those experiences can make a large, unfamiliar campus easier to navigate—both physically and socially.
The digital campus is part of the campus experience
It’s tempting to think of a university’s digital experience and its physical campus as two separate things. For students, families, and visitors, that line is increasingly blurred.
A phone helps someone find parking before they ever step out of the car. A map gets a new student to the right building. Directions help them cross campus, and an events calendar shows them what’s happening later that day.
Digital tools don’t replace the campus experience. They help people take part in it, and back-to-school shows that at remarkable scale. Between August 1 and September 11, Concept3D Interactive Maps recorded 10.94 million map views. During the back-to-school period, visitors opened locations 9.45 million times, searched maps 2.53 million times, and requested directions nearly 1 million times.
But behind every number is a much smaller moment: someone trying to figure out where to go or what to do next.
The best digital campus tools make those moments easier, so people can spend less time finding their way around and more time enjoying being there.
Want to see how maps, events, and other digital experiences can work together across the student journey? Explore the Concept3D platform and see how institutions are connecting people with the places, resources, and experiences that make up campus life.