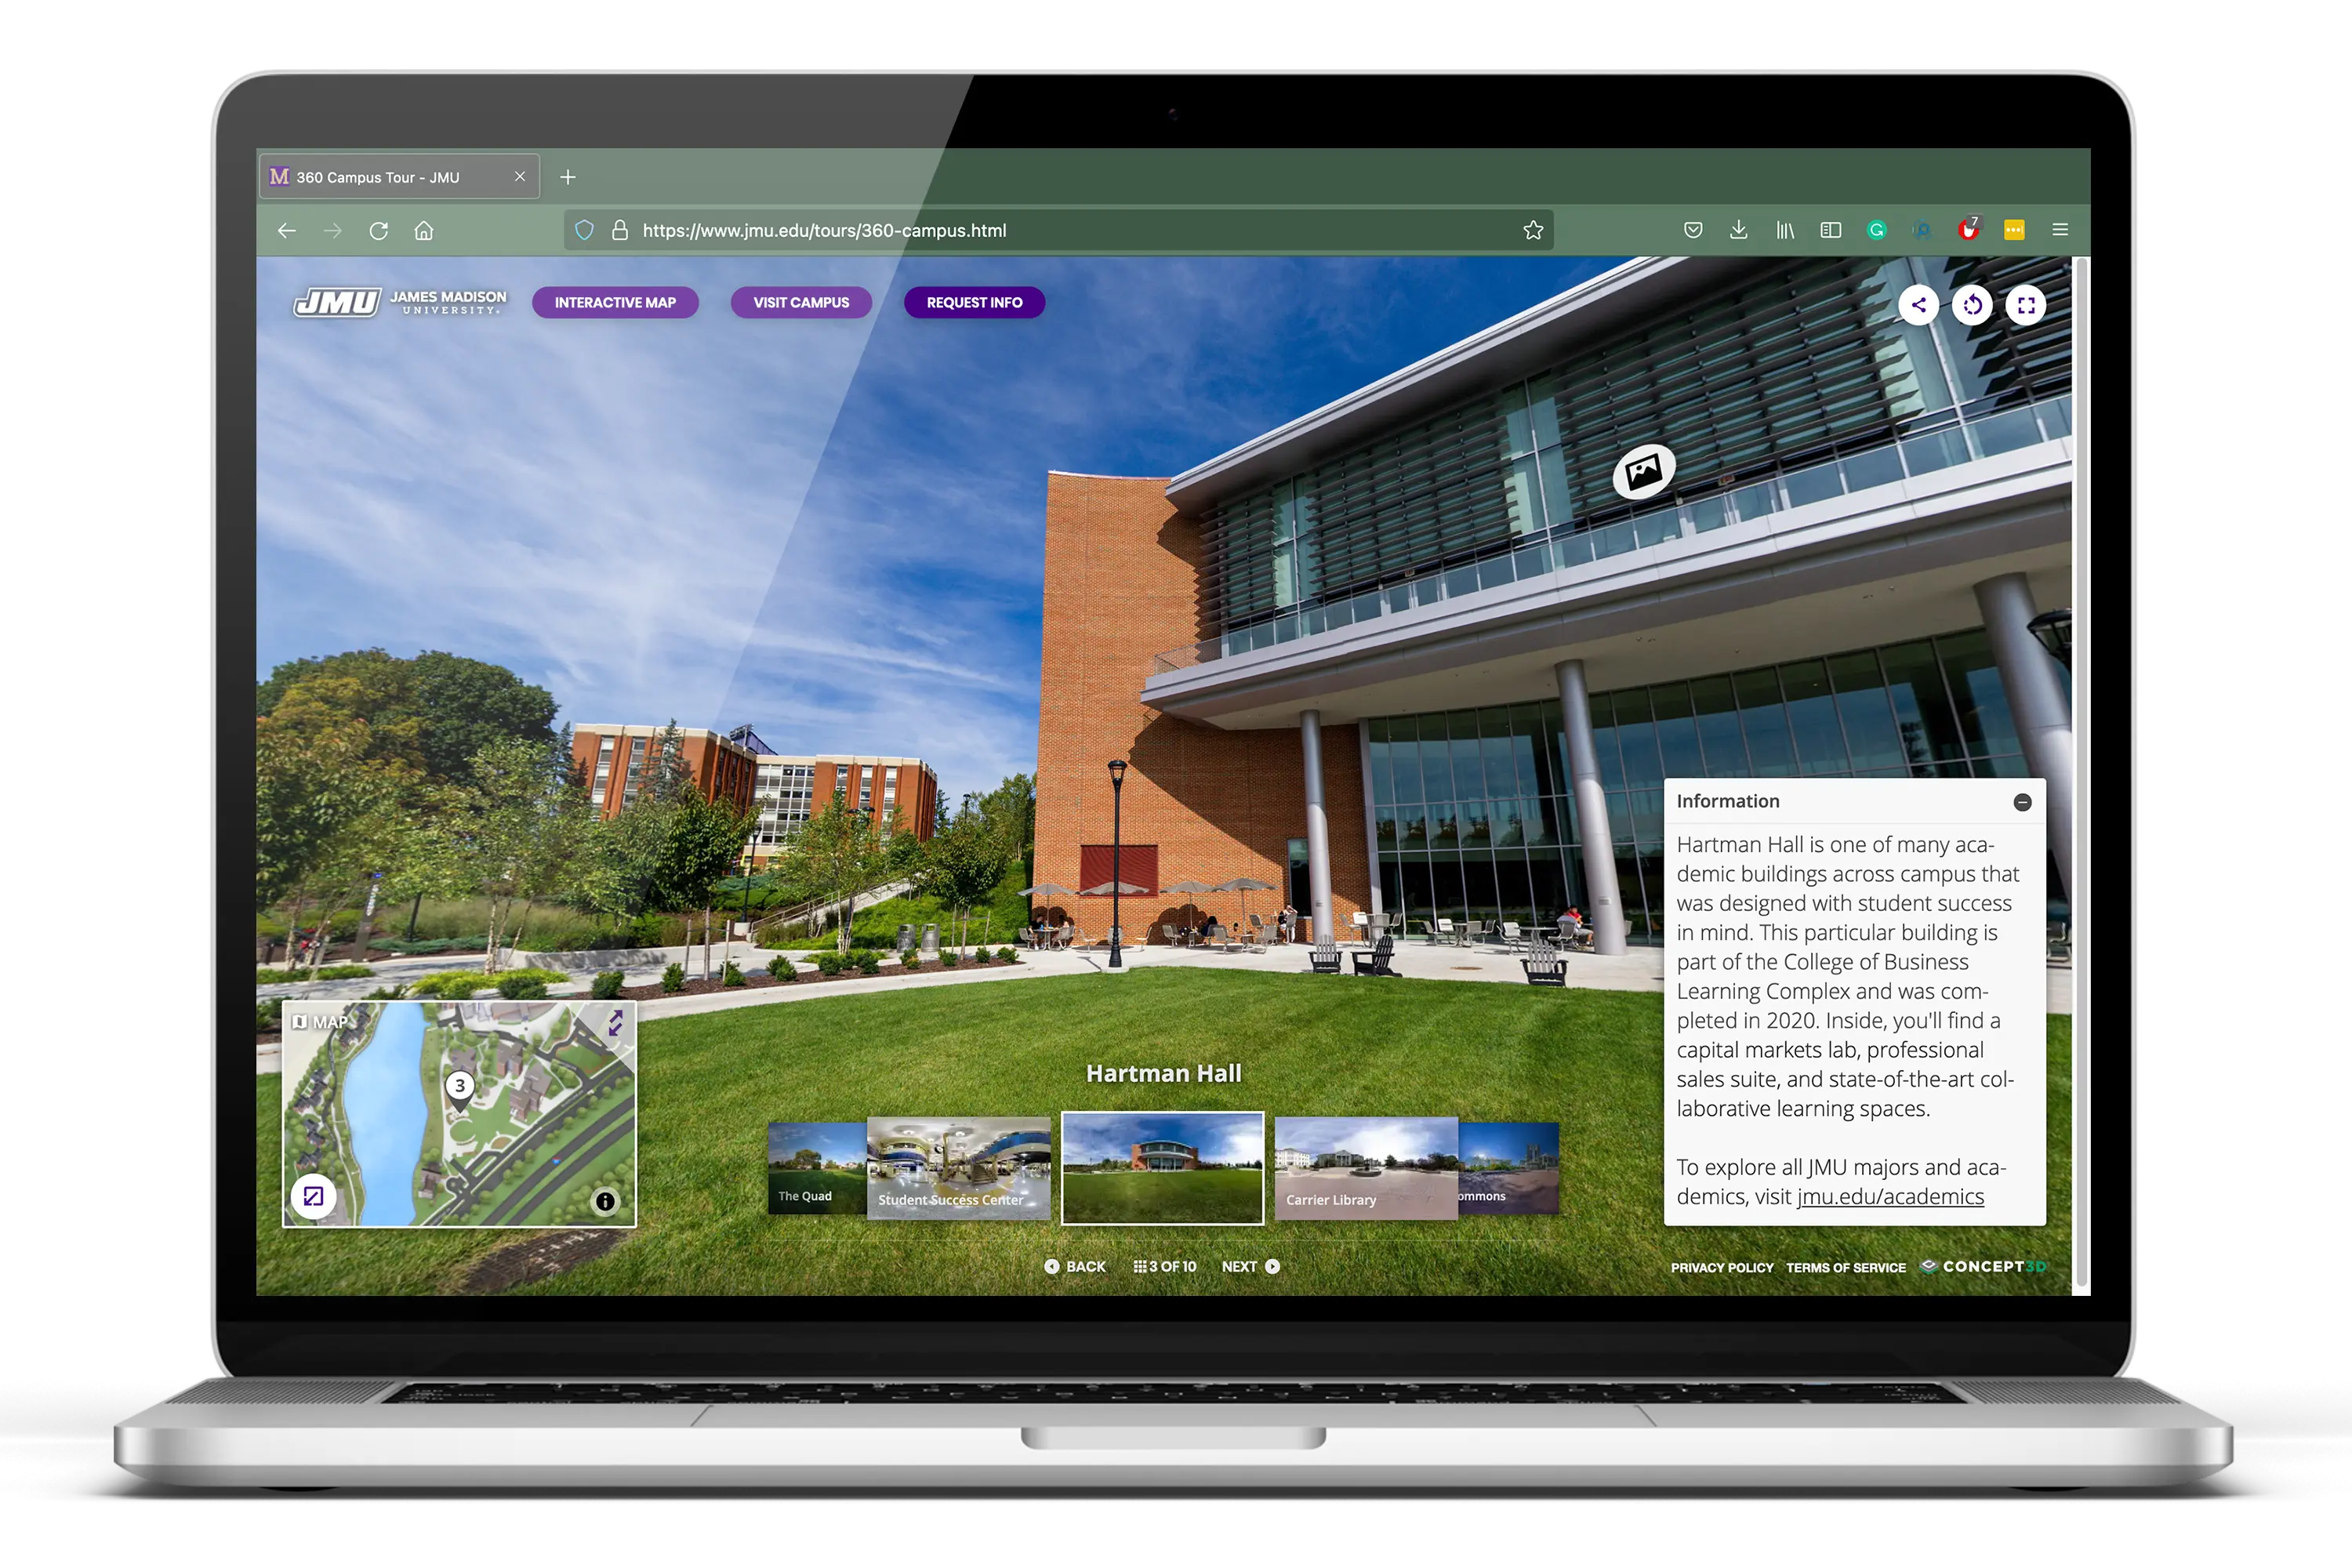
360º Tour
Stats and Facts

Download PDF

Our Clients Make an Impact Online

Improve your engagement and conversion with applicants, students, and their families.

Icon for pages

8.4

Pages a Session

Industry Benchmark:

2.3 Pages per sess.

Icon for pages

85%

of Students were

more likely to select a school

with a detailed virtual tour

Icon for pages

3:21 Min

Time on Page

Industry Benchmark:

2:10 Min

Source: Google Analytics, client shared data, forms, and industry benchmarks.

“It has been very exciting to have the 360º Tour as a tool to encourage students to come to our college, especially during the pandemic. We are clearly seeing an uptick in our data coming through via Google Analytics”

Olivia Robinson

Digital Marketing Associate

Bristol community college logo
Read the case study

Our 360º Tour clients see up to 35,000 views a month.

Click a logo to see an amazing virtual tour.

Interested in how you can implement a 360º Tour tailored to your university’s needs?

Request a demo button

Explore More Examples of Our Work

Transform your online experience.

See our technology come together in one seamless experience.
Contact Us
Request A Demo